USGS-Topoview

http://ngmdb.usgs.gov/maps/TopoView/

USGS Topoview is mapping software that displays historic topographic maps and shows how the maps have changed over time. The maps are restricted to North America, which limits the amount of data that can be displayed. By selecting a time period, it is possible to view which topographic maps are available for selected areas of America. These topographic maps can be downloaded and shared (see below).

USGSexample

Overall I would rate this site as 2/5, as the topographic maps provided are of good quality however the sites data source is limited.


Social Explorer

http://www.socialexplorer.com/tour

Social Explorer is a website designed to allow both technical and non-technical users to gain new insights and realize benefits from large, complex or diverse data. The website makes it possible to create maps from a range of data sources (e.g. US Census, World Development Indicators, UK Census). Users can select datasets from the homepage and change the data using a button to the top right of the map. The website has a variety of options for customising maps. For example, by clicking on the legend in the top right corner you can customise the visualisation type, colour scheme, points, etc (shown below).

SocialExplorerCustomise

It is also possible to alter the level of geographic data displayed on the map using the search bar to the top left of the map to focus on a specific location.

SocialExplorerSearch

When scrolling over the map more detailed information about what the data is displaying pops up. This interactive feature means that users can get as much information from the dataset as possible, without displaying too much data on the base map.

SocialExplorerInteractive.PNG

Once the user has completed their map it is possible to save, share and export the map they have created using the buttons located at the top of the screen (see below). It is also possible to compare maps on the same screen using the button at the bottom of the map.

SocialExplorerShare.PNG

Overall I would rate this site as 5/5, as it allows the user to create interesting and personal maps of frequently updated data.
Maptube

http://www.maptube.org/

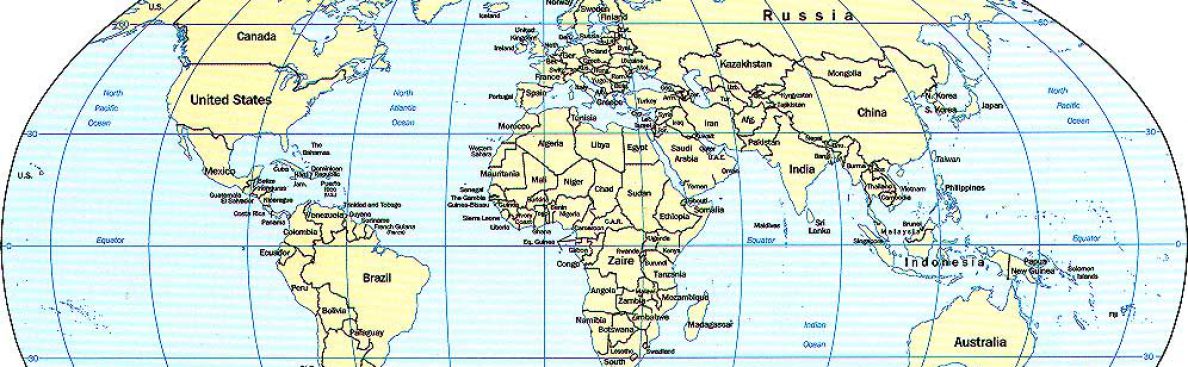
Maptube is a free resource for viewing, sharing, mixing and mashing maps online. Created by UCL’s Centre for Advanced Spatial Analysis, users can select any number of maps to overlay and view. The website is easy to navigate with maps sorted into categories based on the type of data they display (picture below).

MaptubeCategories

It is possible when looking for maps to overlay to use the search bar and add selected maps. You can then view the layers you have chosen in the top right hand corner of the screen. The image below is an example of the search tool.

MaptubeMapSelection


MaptubeOverlayExample

The photo above is an example of the type of map that can be produced by overlaying different maps on the site. The hyperlink to the top right of the map provides a link to the map meaning that it can be embedded elsewhere. The maps produced are aesthetically pleasing and are good for the comparison of numerous datasets. Users are not limited to maps provided by the website, they can upload maps made on Google Map Creator. The only downfall to this site is that users are limited to displaying data on a Google Maps base layer. Overall I would rate this site as a 4/5 as it is good for displaying multiple datasets.

Dataseed

https://getdataseed.com/?_ga=1.96790172.2006823985.1467018103

Dataseed is a website for creating interactive visualisations with minimal fuss. Through the website you can create a combination of charts to represent a dataset. These can be chosen from the drop down menu on the top right (as shown below). They provide a range of charts with the option to map data for spatial context. Once you have chosen the type of graphs that you would like to use it is possible to customise them with the toolbar also located in the top right corner. This gives users the opportunity to personalise their information, with a professional looking outcome.

DataseedCharts

For users who are new to the website there is a tutorial video showing how to use the software. There is also the option to ask for support, by entering a question into the form in the bottom right of the screen (highlighted below).

Dataseed support

Once the user has created their charts there are buttons to embed/share the map. The limitation to this site is that it is not freely available to use, however there is a free 15-day trial so that the user can test its suitability. Overall I would give this site a 4/5, as it is a good quality way of representing data, only to be made better by becoming a free resource.